
F Distribution for ANOVA
Tags | |
UUID | 3702db84-33ca-11e6-9770-bc764e2038f2 |
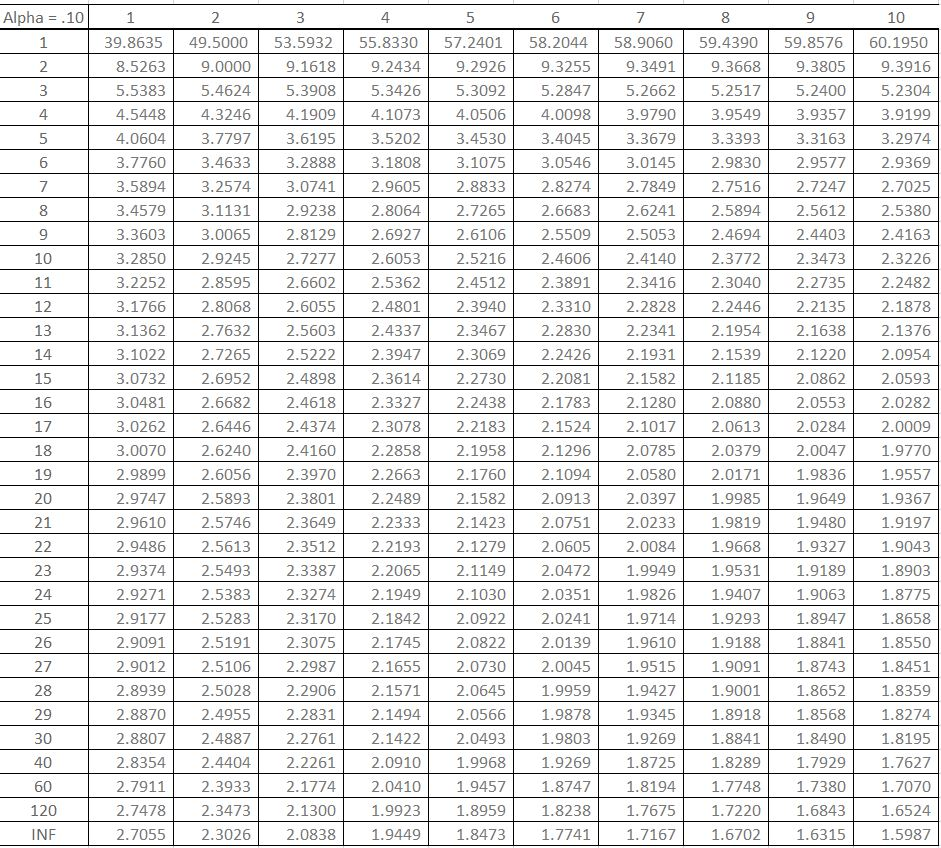
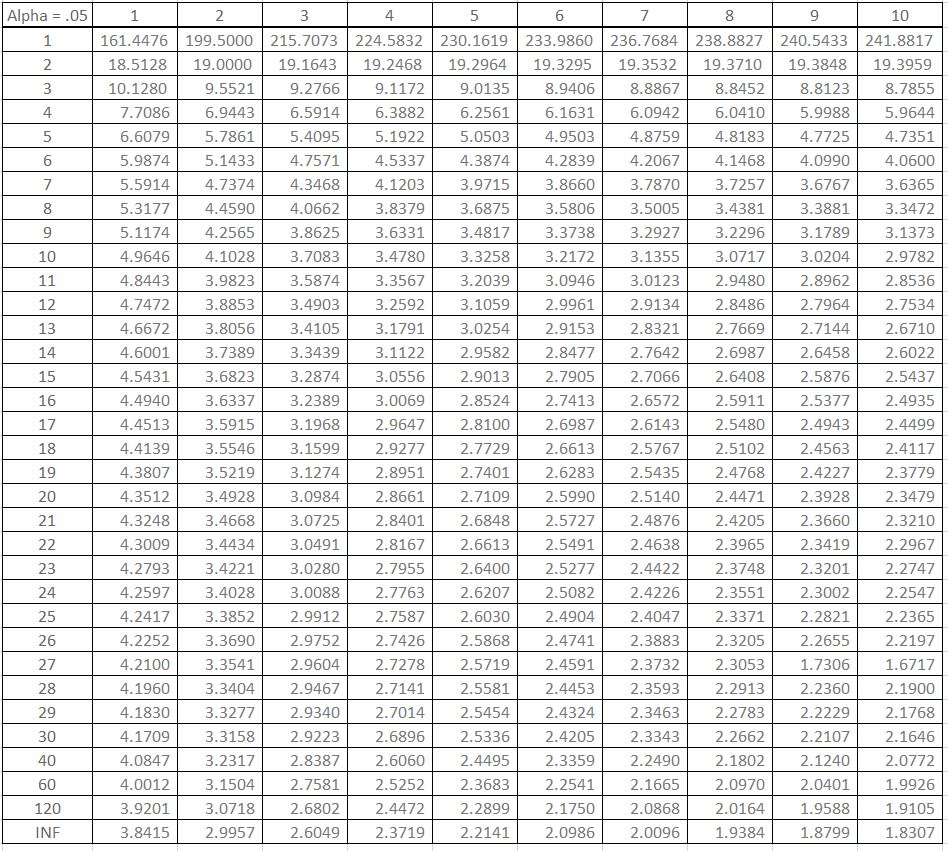
The F Distribution Table is used to find the correct critical value of F, which determines what results are significant for a set of data. It is used for ANOVAs, where the result is an F-ratio, and in calculating the significance of a regression line (Gravetter and Wallnau, 2013). The critical F is reported in the following equations: repeated-measures ANOVA, one-way ANOVA, and factorial ANOVA. The dataset has a column for the degrees of freedom denominator (df) and 4 additional columns to give the F-value, given a degrees of freedom numerator as 1, 2, 3, or 4. The critical F is reported at .05 and 0.01 significance (α value).
To compute the One-way ANOVA f-score for a table of data, CLICK HERE.
F - Tables
Alpha = 0.1
Alpha = 0.05
Statistics Calculators
- Observational Stats: This function accepts a table of numbers separated by commas and calculates observational statistics for any of the columns. This includes count, min, max, sum, sum of squares (Σx²), square of the sum (Σx)², mean, median, mode, range, mid point, rand, sort up, sort down, rand, population variance, population standard deviation, the sample/experimental variance, sample/experimental standard deviation.
- Frequency Distribution: This function lets you enter a string of numbers separated by commas, a low and high range and a number of bins. It then computes how many of the observations are in each of the bins between the high and low values designated.
- Paired Sample t-test: This computes the various parameters associated with the Paired Sample t-test.
- ANOVA (one way): The is one way analysis of variance
- (χ2) Chi-Square Test: This computes the Chi-Square value for an nxm array of data and provides the degrees of freedom.
- Linear Regression: This computes the regression line (least-squares) through a set of X and Y observations. It also computes the regression coefficient (r).
- y = a + bx: This is linear equation used with Linear Regression to predict values of Y.
- Wilcoxon Signed Rank Test: This provides the Wilcoxon statistics and critical value for two groups of numeric observations based on an alpha value and whether it's a one or two tailed test.
- Slope-Intercept form of a Line based on two points.
- Slope between two points
- Range value based on the slope-intercept formula of a line and a value of the domain.
- Compute the Probability between z SCORES
- College Level Statistics Calculator (Stat Calc).
- Count of Observations in a Set - this is the number (n) of values in a set.
- Minimum Value in a Set - this is the minimum observed value
- Maximum Value in a Set- this is the maximum value in the set.
- Numeric Sort (up and down) - this returns a comma separated list of the observations in ascending or descending order.
- Create a random subset of the a list of numeric values
- Random number from a range you specify
- Frequency distribution of data.
- Σx - this is the sum of the values in a set.
- Σx² - this is the sum of the squared values
- (Σx)² - this is the square of the summed values.
- Mean - the is the mean (average) of the observed values
- Median - the middle ordered value
- Mode - the most recurring observation
- Mid Point in a Set - this is the mid point of the observation range.
- Range in a Set - this is the difference between the max and the min.
- Population Variance of the values
- Population standard deviation of the values
- Sample Variance of the values
- Sample Standard Deviation of the values
- Compute the z SCORE based on the mean and standard deviation
- Compute the z SCORE in a set of observations
- Compute the percentile of a single observation (y) in a set (X)
- SDOM - standard deviation of mean
Entered | By | df denominator | F-value numerator 1 | F-value numerator 2 | F-value numerator 3 | F-value numerator 4 |
|---|
2016-06-17 11:06:34 | Caroline4 | 48 | 4.04 | 3.19 | 2.8 | 2.56 |
2016-06-17 11:06:28 | Caroline4 | 47 | 4.05 | 3.2 | 2.8 | 2.57 |
2016-06-17 11:06:24 | Caroline4 | 46 | 4.05 | 3.2 | 2.81 | 2.57 |
2016-06-17 11:06:16 | Caroline4 | 45 | 4.06 | 3.2 | 2.81 | 2.58 |
2016-06-17 11:06:11 | Caroline4 | 44 | 4.06 | 3.21 | 2.82 | 2.58 |
2016-06-17 11:06:06 | Caroline4 | 43 | 4.07 | 3.21 | 2.82 | 2.59 |
2016-06-17 11:05:57 | Caroline4 | 42 | 4.07 | 3.22 | 2.83 | 2.59 |
2016-06-17 10:44:45 | Caroline4 | 41 | 4.08 | 3.23 | 2.83 | 2.6 |
2016-06-17 10:40:53 | Caroline4 | 40 | 4.09 | 3.23 | 2.84 | 2.61 |
2016-06-16 10:12:43 | Caroline4 | 39 | 4.09 | 3.24 | 2.85 | 2.61 |
This dataset, F Distribution for ANOVA, is used in 5 pages
Collections
- Comments
- Attachments
- Stats
No comments |
This site uses cookies to give you the best, most relevant experience. By continuing to browse the site you are agreeing to our use of cookies.