Processing...
The equation editor Plotting Tab lets the 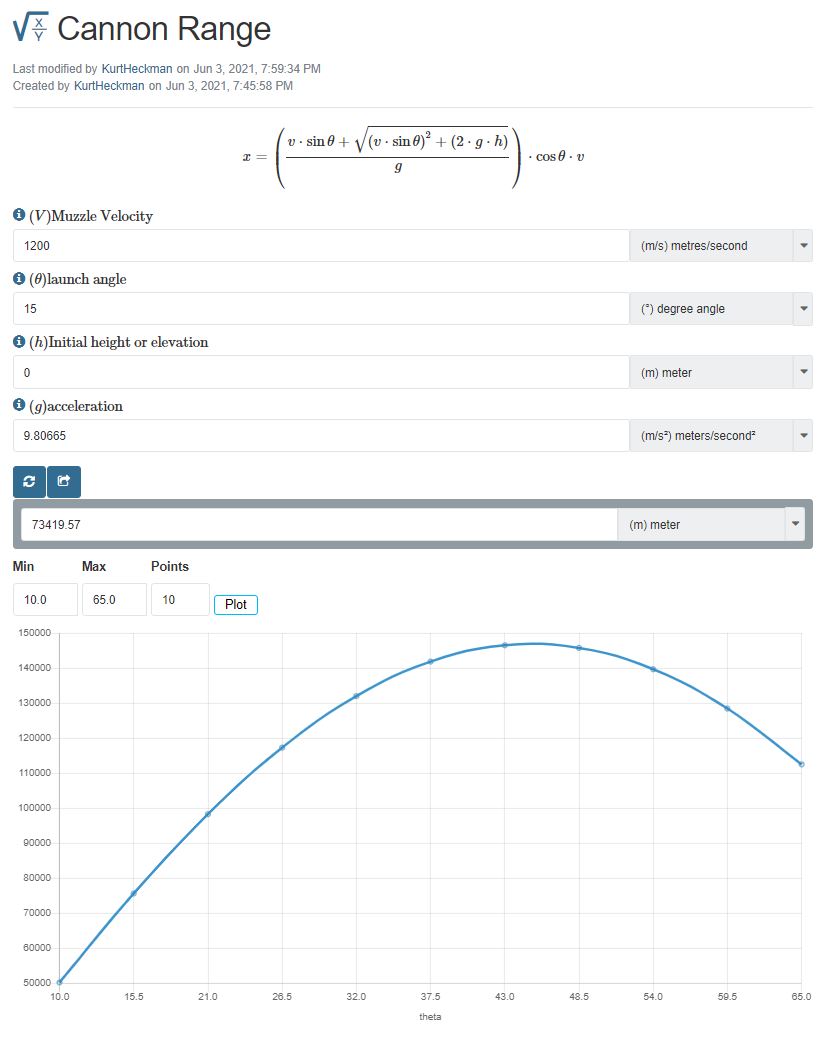 equation creator specify if a graphing / plotting feature will be added to the equation page.
Using this feature, the equation creator / editor can specify a 2D plot that has one input parameter on the X axis and a range of the X axis values (min / max). When the user enters the rest of the parameters, a graph is displayed with the calculator results based on even increment of the X axis parameter between the minimum and maximum.
In the example to the right (Canon Range), the equation had four input parameters:
- Initial Velocity
- Launch Angle
- Initial Height
- Acceleration due to Gravity.
For plotting, the X axis was set to the launch angle (θ) with a minimum of 10° and a maximum of 65°.