Tags | |
The Probability between Raw Scores calculator computes the area under the Normal Distribution curve between two raw scores.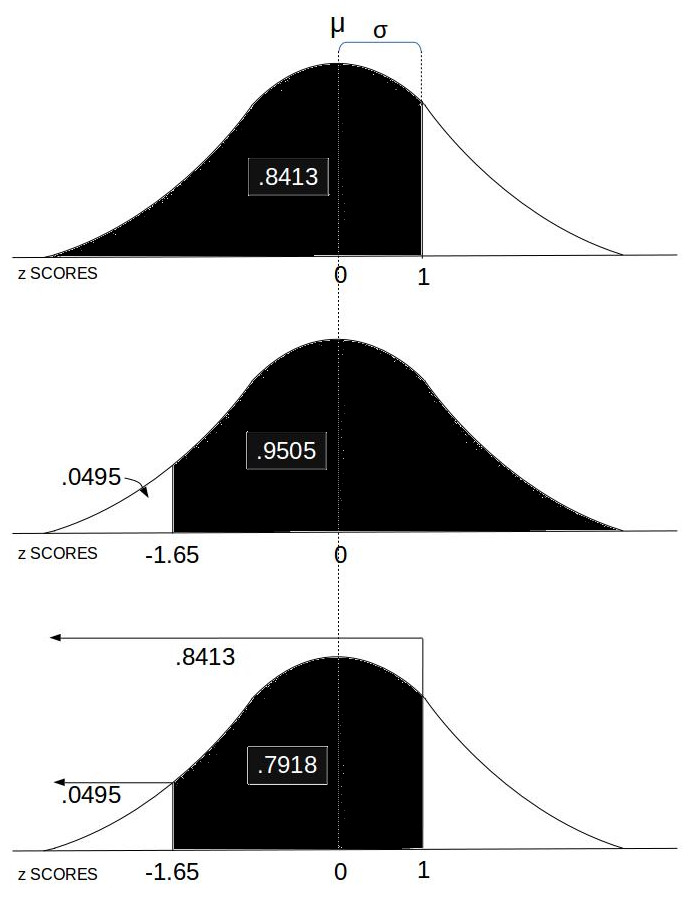 Probability & Normal Distribution This equates to the probability of a score in that range.
INSTRUCTIONS: Enter the following:
- (y1): This is the first raw score.
- (y2): This is the second raw score.
- (mu): This is the mean of the normal distribution.
- (sd): This is the standard deviation of the normal distribution.
Area Under the Normal Curve: The calculator returns the area under the Normal Distribution curve between the raw scores. This is equivalent to the probability of score between the raw scores. It ranges from 0.00001 to 0.99999.
The Probability between Raw SCOREs function is a prominent feature with other statistical functions in the College Level Statistics Calculator (Stat Calc).
RELATED CALCULATORS:
- To compute the probability between two z SCORES, CLICK HERE.
- To compute the z SCORE based on the mean and standard deviation, CLICK HERE.
- To compute the z SCORE in a set of observations, CLICK HERE.
- To compute the percentile of a single observation (y) in a set (X), CLICK HERE.
- To sort a list of numeric values, CLICK HERE.
- To create a random subset of the a list of numeric values, CLICK HERE.