To evaluate the relationship between a titration’s equivalence point and its end point, we need to construct only a reasonable approximation of the exact titration curve. In this section we demonstrate a simple method for sketching an acid–base titration curve. Our goal is to sketch the titration curve quickly, using as few calculations as possible. Let’s use the titration of 50.0 mL of 0.100 M CH3COOH with 0.200 M NaOH to illustrate our approach.
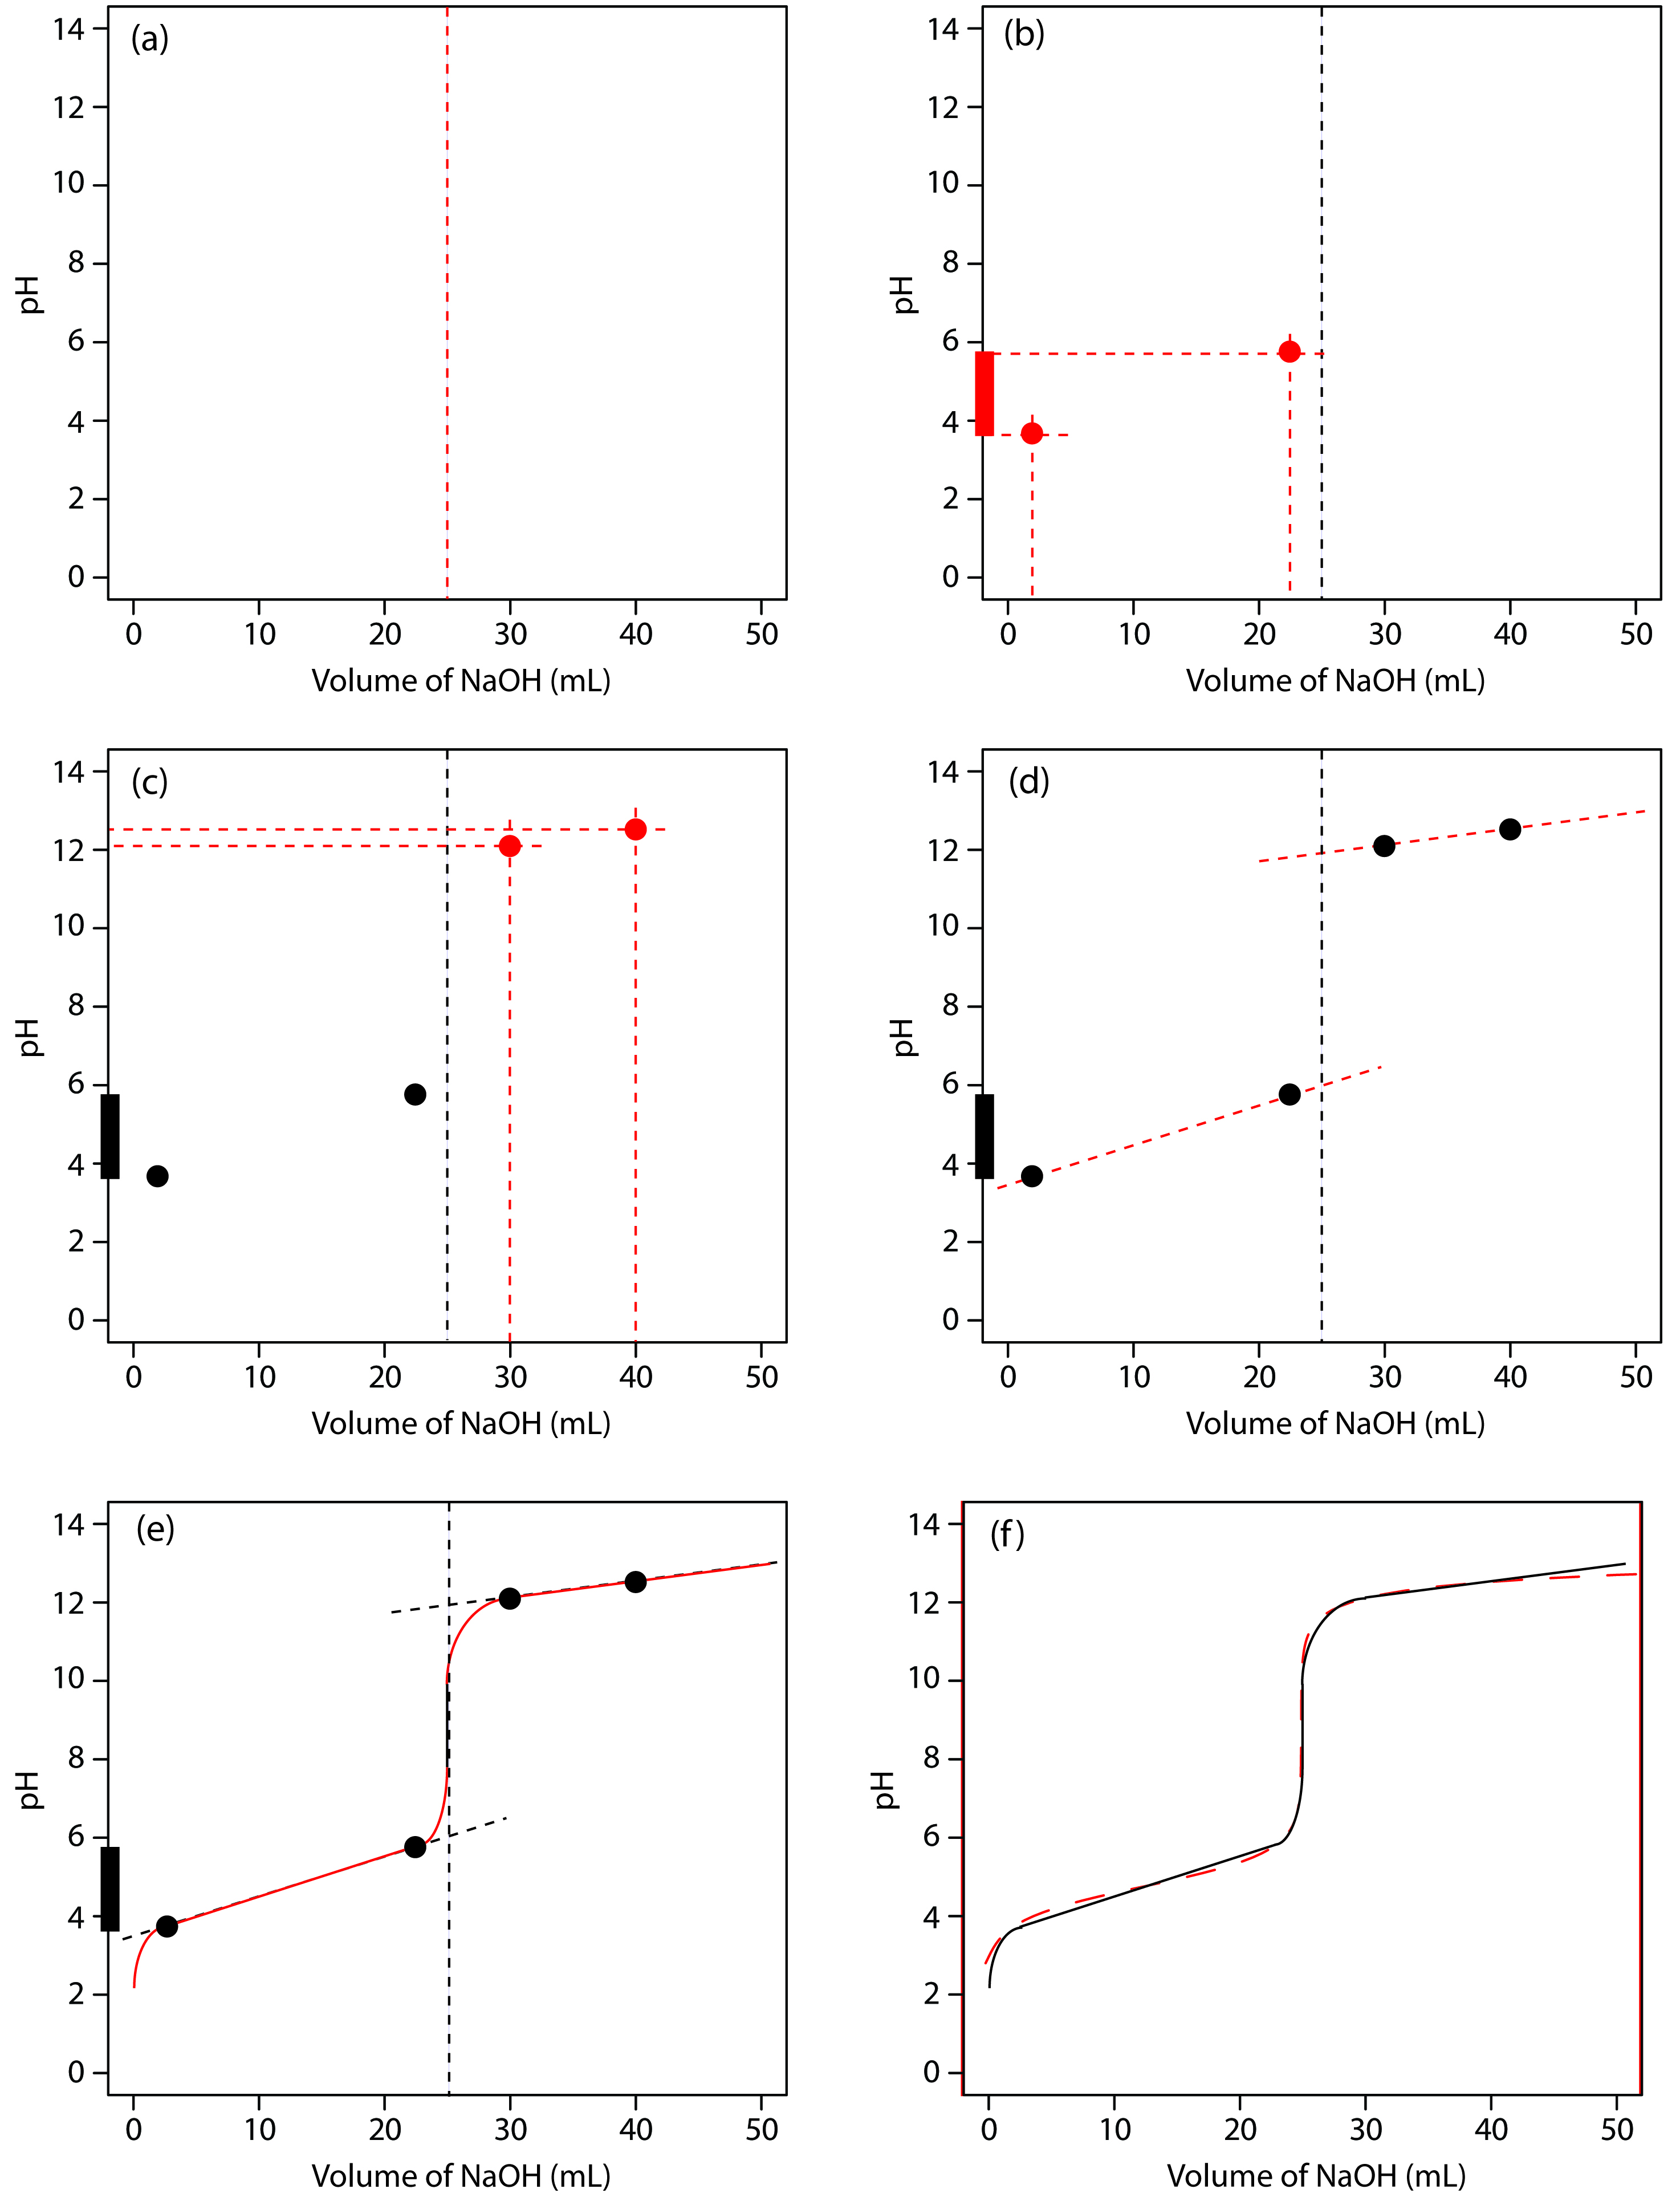
We begin by calculating the titration’s equivalence point volume, which, as we determined earlier, is 25.0 mL. Next we draw our axes, placing pH on the y-axis and the titrant’s volume on the x-axis. To indicate the equivalence point volume, we draw a vertical line corresponding to 25.0 mL of NaOH. Figure 9.8a shows the result of the first step in our sketch.

Figure 19.2.1 Illustrations showing the steps in sketching an approximate titration curve for the titration of 50.0 mL of 0.100 M CH3COOH with 0.200 M NaOH: (a) locating the equivalence point volume; (b) plotting two points before the equivalence point; (c) plotting two points after the equivalence point; (d) preliminary approximation of titration curve using straight-lines; (e) final approximation of titration curve using a smooth curve; (f) comparison of approximate titration curve (solid black line) and exact titration curve (dashed red line). See the text for additional details.
Before the equivalence point the titration mixture’s pH is determined by a buffer of acetic acid, CH3COOH, and acetate, CH3COO–. Although we can easily calculate a buffer’s pH using the Henderson–Hasselbalch equation, we can avoid this calculation by making a simple assumption. You may recall from Chapter 6 that a buffer operates over a pH range extending approximately ±1 pH unit on either side of the weak acid’s pKa value. The pH is at the lower end of this range, pH = pKa – 1, when the weak acid’s concentration is 10× greater than that of its conjugate weak base. The buffer reaches its upper pH limit, pH = pKa + 1, when the weak acid’s concentration is 10× smaller than that of its conjugate weak base. When titrating a weak acid or a weak base, the buffer spans a range of volumes from approximately 10% of the equivalence point volume to approximately 90% of the equivalence point volume.
Figure 9.8b shows the second step in our sketch. First, we superimpose acetic acid’s ladder diagram on the y-axis, including its buffer range, using its pKa value of 4.76. Next, we add points representing the pH at 10% of the equivalence point volume (a pH of 3.76 at 2.5 mL) and at 90% of the equivalence point volume (a pH of 5.76 at 22.5 mL).
| The actual values are 9.09% and 90.9%, but for our purpose, using 10% and 90% is more convenient; that is, after all, one advantage of an approximation! Problem 9.4 in the end-of-chapter problems asks you to verify these percentages. |
The third step in sketching our titration curve is to add two points after the equivalence point. The pH after the equivalence point is fixed by the concentration of excess titrant, NaOH. Calculating the pH of a strong base is straightforward, as we have seen earlier. Figure 19.2.1c shows the pH after adding 30.0 mL and 40.0 mL of NaOH.
Next, we draw a straight line through each pair of points, extending the lines through the vertical line representing the equivalence point’s volume (Figure 19.2.1d). Finally, we complete our sketch by drawing a smooth curve that connects the three straight-line segments (Figure 19.2.1e). A comparison of our sketch to the exact titration curve (Figure 19.2.1f) shows that they are in close agreement.