Tags | |
UUID | 19d03bcc-f145-11e9-8682-bc764e2038f2 |
The Integrated Rate Equations
From UCDavis Chemwiki and UCDavis Chemwiki link two
Zero-Order Reactions
A zero-order reaction is a reaction that proceeds at a rate that is independent of reactant concentration. Typically with increasing or decreasing reactants concentrations not affecting the observed reaction. This means that the rate of the reaction is equal to the rate constant, k, of that reaction. This property differs from both first-order reactions and second-order reactions.
The Differential Form of the Rate Law
Differential rate laws are generally used to describe what is occurring on a molecular level during a reaction, whereas integrated rate laws are used for determining the reaction order and the value of the rate constant from experimental measurements. The differential equation describing first-order kinetics is given below:
Rate =-(d[A])dt=k[A]1=k[A]
The "rate" is the reaction rate (in units of molar/time) and kk is the reaction rate coefficient (in units of 1/time). However, the units of k vary for non-first-order reactions. These differential equations are separable, which simplifies the solutions as demonstrated below.
The Integrated Form of the Rate Law
First, write the differential form of the rate law.
Rate =-d[A]dt=k[A]1=k[A]
Rearrange to give:
dAA=-kdt
Second, integrate both sides of the equation.
∫[A][A]od[A][A]=-∫tt0kdt
∫[A][A]o1[A]d[A]=-∫tt0kdt
Recall from calculus that:
∫1x=ln(x)
Upon integration,
ln[A]-ln[A]o=-kt
Rearrange to solve for [A] to obtain one form of the rate law:
ln[A]=ln[A]o-kt
This can be rearranged to:
ln[A]=-kt+ln[A]o
This can also be synonymous with y = mx + b form.
The equation is a straight line with slope m:
mx=-kt
and y-intercept b:
b=ln[A]o
Now, recall from the laws of logarithms that
ln([A]t[A]o) =-kt
where [A] is the concentration at time t and [A]o is the concentration at time 0, and k is the first-order rate constant.
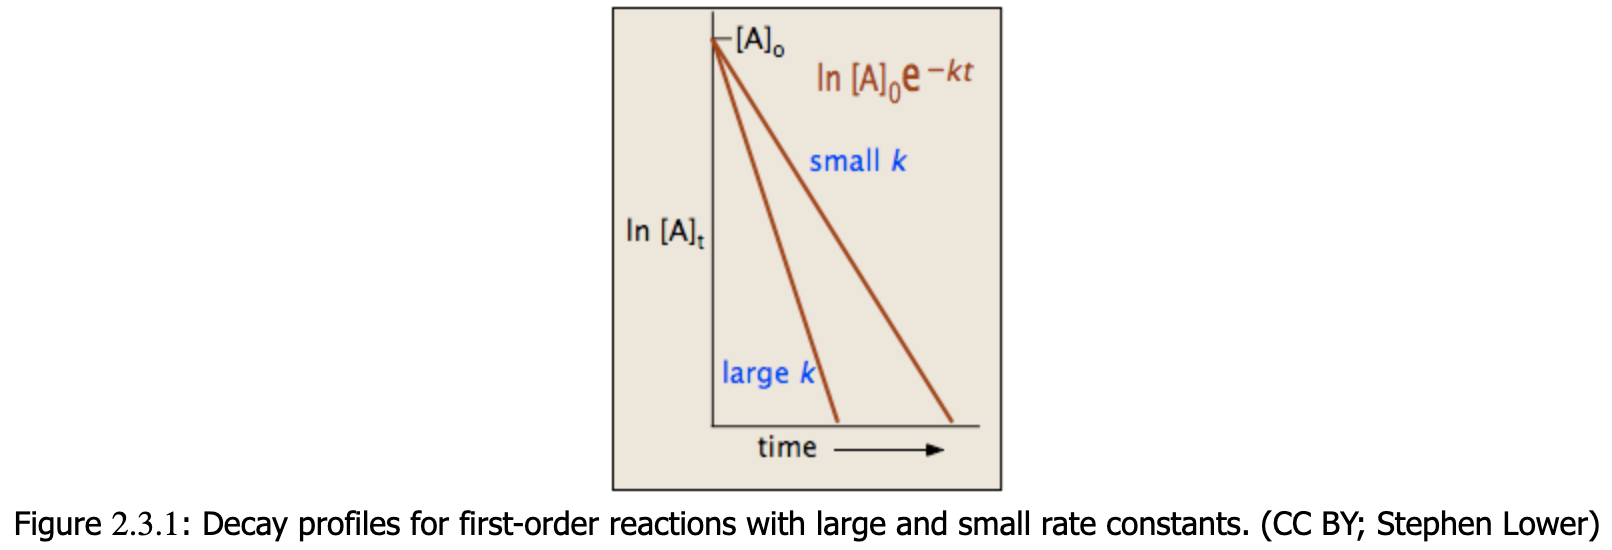
The integrated form of the rate law allows us to find the population of reactant at any time after the start of the reaction. For more information on differential and integrated rate laws, see rate laws and rate constants. This derived formula is the main important one to understand, the math to get to it does not necessarily need to be understood (though knowing it would always be better).
Graphing Zero-order Reactions
Zero-order reactions are only applicable for a very narrow region of time. Therefore, the linear graph shown below (Figure 1) is only realistic over a limited time range. If we were to extrapolate the line of this graph downward to represent all values of time for a given reaction, it would tell us that as time progresses, the concentration of our reactant becomes negative. We know that concentrations can never be negative, which is why zero-order reaction kinetics is applicable for describing a reaction for only brief window and must eventually transition into kinetics of a different order.
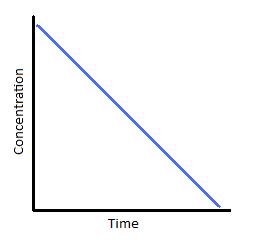
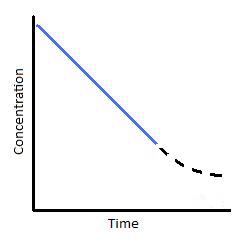
Figure 1 (left) Concentration vs. time of a zero-order reaction. and Figure 2 (Right) Concentration vs. time of a zero-order catalyzed reaction.
To understand where the above graph comes from, let us consider a catalyzed reaction. At the beginning of the reaction, and for small values of time, the rate of the reaction is constant. This is indicated by the blue line in both graph above and below (Figures 1 and 2, respectively). This situation typically happens when a catalyst is saturated with reactants. With respect to Michaelis-menton Kinetics, this point of catalyst saturation is related to the Vmax. As a reaction progresses through time, however, it is possible that less and less substrate will bind to the catalyst. As this occurs, the reaction slows and we see a tailing off of the graph (Figure 2). This portion of the reaction is represented by the dashed black line. In looking at this particular reaction, we can see that reactions are not zero-order under all conditions. They are only zero-order for a limited amount of time.
If we plot rate as a function of time, we obtain the graph below (Figure 3). Again, this only describes a narrow region of time. The slope of the graph is equal to k, the rate constant. Therefore, k is constant with time. In addition, we can see that the reaction rate is completely independent of how much reactant you put in.
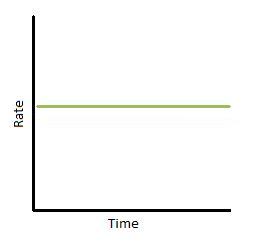
Figure 3. Rate vs. time of a zero-order reaction.
Relationship Between Half-life and Zero-order Reactions
The half-life is a timescale in which each half-life represents the reduction of the initial population to 50% of its original state. We can represent the relationship by the following equation.
[A]=12[A]0
Using the integrated form of the rate law, we can develop a relationship between zero-order reactions and the half-life.
[A]=[A]0-kt
Substitute
12[A]0=[A]0-kt12
Solve for t1/2
Notice that, for zero-order reactions, the half-life depends on the initial concentration of reactant and the rate constant.
First-Order Reactions
A first-order reaction is a reaction that proceeds at a rate that depends linearly only on one reactant concentration.
The Differential Form
A first-order reaction is a reaction that proceeds at a rate that depends linearly only on one reactant concentration. The differential equation describing first order kinetics is:
Rate is the reaction rate (in unites of molar/time) and k is the reaction rate coefficient (in units of 1/time). However, the units can vary with other order reactions. These differential equations are separable, which simplifies the solutions.
The Integral Form
First, write the differential form of the rate law.
Rate =-d[A]dt=k[A]
is at the time t with its final concentration of A and [A]o is at time 0 and it is at its initial concentration of [A]o and kis the rate constant. Since, the logarithms of numbers do not have any units, the product of -kt does not have units as well. This concludes that unit of k in a first order of reaction must be time-1. Examples of time-1 would be s-1 or min-1. Thus, the equation of a straight line is applicable to represent:
ln[A]=-kt+ln[A]o.
To test if it the reaction is a first order reaction, plot the natural logarithm of a reactant concentration versus time and see whether the graph is linear. If the graph is linear and has a negative slope, the reaction must be a first order reaction.
To create another form of the rate law, raise each side of the previous equation to the exponent,
eln[A]=eln[A]o-kt
Taking the natural log of both sides of the equation, we get the second form of the rate law
[A]=[A]oe-kt
The integrated forms of the rate law allow us to find the population of reactant at any time after the start of the reaction. Plotting ln[A] with respect to time for a first-order reaction gives a straight line with the slope of the line equal to ?k. For more information on differential and integrated rate laws.
Graphing First-order Reactions
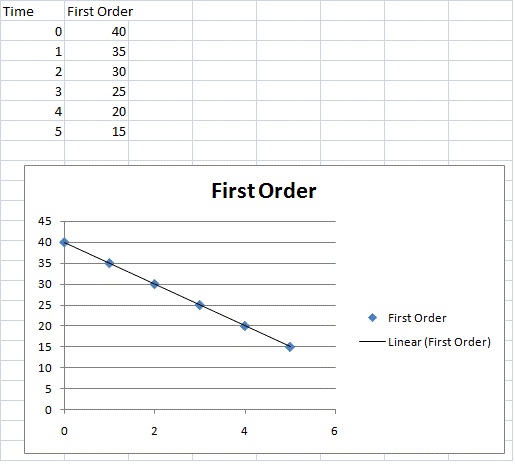
The following graphs represents concentration of reactants versus time for a first-order reaction.
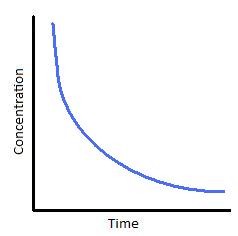
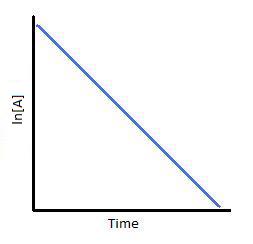
Plotting ln[A] with respect to time for a first-order reaction gives a straight line with the slope of the line equal to ?k.
Half-live of First order Reactions
The half-life (t1/2) is a timescale by which the initial population is decreased by half of its original value. We can represent the relationship by the following equation.
[A]=12[A]o
After a period of one half-life, t_(1"/"2) and we can write,
[A]1/2[A]o=12=e-kt1/2
Taking logarithms of both sides (remember that ln ex =x) yields
ln0.5--kt
Solving for the half-life, we obtain the simple relation
t12=ln2k≈0.693k
Notice that, for first-order reactions, the half-life is independent of the initial concentration of reactant, which is a unique aspect to first-order reactions. The practical implication of this is that for [A] to decrease from 1 M to 0.5 M, it takes much time as it does for [A] to decrease from 0.1 M to 0.05 M
| Example 2: Determining Half life |
|---|
| The anticancer drug cisplatin hydrolyzes in water with a rate constant of 1.5 × 10?3 min?1 at pH 7.0 and 25°C. Calculate the half-life for the hydrolysis reaction under these conditions. Worked Problem Here |
Second-Order Reactions
Many important biological reactions, such as the formation of double-stranded DNA from two complementary strands, can be described using second order kinetics. In a second-order reaction, the sum of the exponents in the rate law is equal to two. The two most common forms of second-order reactions will be discussed in detail in this section.
Reaction Rate
where k is a second order rate constant with units of M-1min-1 or M-1s-1. Therefore, doubling the concentration of reactant A will quadruple the rate of the reaction. In this particular case, another reactant (B) could be present with A; however, its concentration does not affect the rate of the reaction, i.e., the reaction order with respect to B is zero, and we can express the rate law as v=k[A]2[B]0.
Derivative and Integral Form
To describe how the rate of a second-order reaction changes with concentration of reactants or products, the differential (derivative) rate equation is used as well as the integrated rate equation. The differential rate law can show us how the rate of the reaction changes in time, while the integrated rate equation shows how the concentration of species changes over time. The latter form, when graphed, yields a linear function and is, therefore, more convenient to look at. Nonetheless, both of these equations can be derived from the above expression for the reaction rate. Plotting these equations can also help us determine whether or not a certain reaction is second-order.
ImageThe crucial part of this process is not understanding precisely how to derive the integrated rate law equation, rather it is important to understand how the equation directly relates to the graph which provides a linear relationship. In this case, and for all second order reactions, the linear plot of 1/[A]t versus time will yield the graph below.
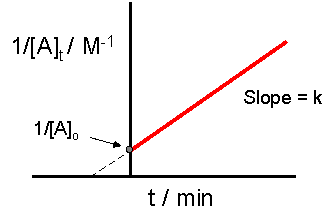
This graph is useful in a variety of ways. If we only know the concentrations at specific times for a reaction, we can attempt to create a graph similar to the one above. If the graph yields a straight line, then the reaction in question must be second order. In addition, with this graph we can find the slope of the line and this slope is k, the reaction constant. The slope can be found be finding the "rise" and then dividing it by the "run" of the line. For an example of how to find the slope, please see the example section below. There are alternative graphs that could be drawn.
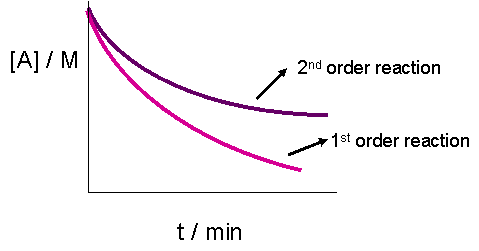
The plot of [A]t versus time would result in a straight line if the reaction were zeroth order. It does, however, yield less information for a second order graph. This is because both the graphs of a first or second order reaction would look like exponential decays. The only obvious difference, as seen in the graph below, is that the concentration of reactants approaches zero more slowly in a second-order, compared to that in a first order reaction.
| Example 3 | |||||||||||||||
|---|---|---|---|---|---|---|---|---|---|---|---|---|---|---|---|
| At high temperatures, nitrogen dioxide decomposes to nitric oxide and oxygen. 2NO2(g)?2NO(g)+O2(g)Experimental data for the reaction at 300°C and four initial concentrations of NO2 are listed in the following table:
Determine the reaction order and the rate constant.
|
Half-Life
Another characteristic used to determine the order of a reaction from experimental data is the half-life (t1/2). By definition, the half life of any reaction is the amount of time it takes to consume half of the starting material. For a second-order reaction, the half-life is inversely related to the initial concentration of the reactant (A). For a second-order reaction each half-life is twice as long as the life span of the one before.
Consider the reaction 2A→P:
We can find an expression for the half-life of a second order reaction by using the previously derived integrated rate equation.
1[A]t-1[A]o=kt
Since,
[A]t_(1/2)=12[A]o
when t=t1/2.
Our integrated rate equation becomes:
112[A]o-(1[A]o)=kt1/2
After a series of algebraic steps,
2[A]o-1[A]o=kt1/2
`1/([A]_o) = kt_(1"/"2)
We obtain the equation for the half-life of a second order reaction:
t12=1k[A]o
This inverse relationship suggests that as the initial concentration of reactant is increased, there is a higher probability of the two reactant molecules interacting to form product. Consequently, the reactant will be consumed in a shorter amount of time, i.e. the reaction will have a shorter half-life. This equation also implies that since the half-life is longer when the concentrations are low, species decaying according to second-order kinetics may exist for a longer amount of time if their initial concentrations are small.
Note that for the second scenario in which A+B→P, the half-life of the reaction cannot be determined. As stated earlier, [A]o cannot be equal to [B]o. Hence, the time it takes to consume one-half of A is not the same as the time it takes to consume one-half of B. Because of this, we cannot define a general equation for the half-life of this type of second-order reaction.
Example 4:
If the only reactant is the initial concentration of A, and it is equivalent to [A]0=4.50⋅10-5M and the reaction is a second order with a rate constant k=0.89M-1s-1. What is the half-life of this reaction?
Solution:
This uses the equation, t12=1k[A]o,
1k[A]o=1(4.5⋅10-5M)(0.89M-1s-1)
=2.50⋅104s
The graph below is the graph that tests if a reaction is second order. The reaction is second order if the graph has a straight line, as is in the example below.

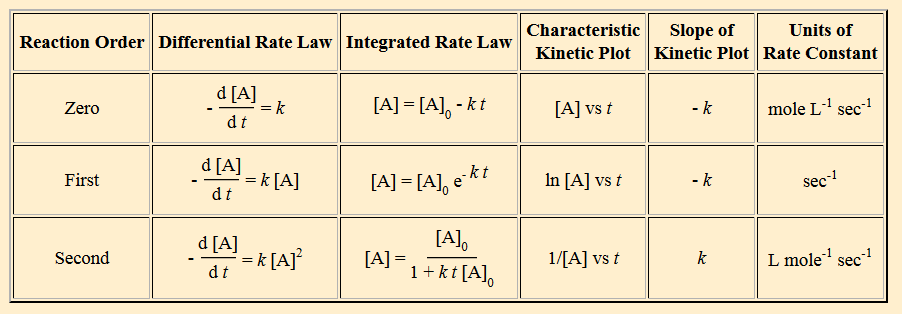
Summary Table
This Collection is empty
- Comments
- Attachments
- Stats
No comments |

