The Least-squares Trend Line calculator computes the regression line, a linear equation, through a set of X and Y values. This is also known as simple linear regression. The Least-square Equation produces this linear equation in the form y = a + bx.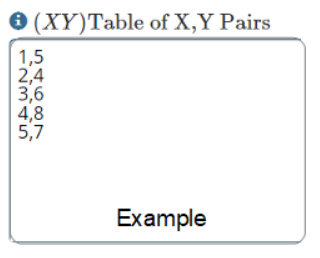
INSTRUCTIONS: Enter the following:
- (X,Y) Tabular Data of X,Y pairs (see Example right)
- (OC) Output Choice (Trend Line, Details)
- (SD) Significant Digits (rounding factor for answer)
Least-squares Trend Line (Y = a + bX): The calculator computes the Least-square Trend Line, correlation coefficient (r) and supporting calculation details:
- (n) Number of Pairs
- (MX) Mean of X values
- (MY) Mean of Y values
- (ΣX) Sum of X values
- (ΣY) Sum of Y values
- (ΣXY) Sum of X⋅Y values
- (ΣX2) Sum of X2 values
- (ΣY2) Sum of Y2 values
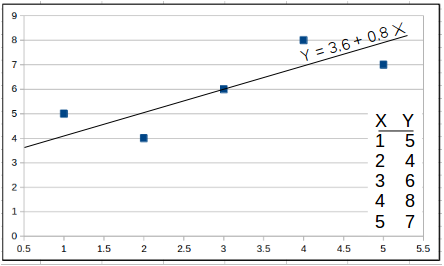
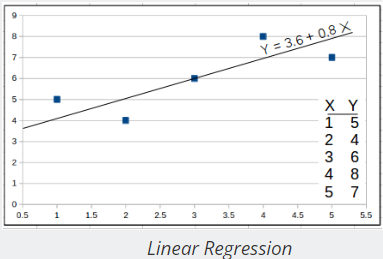
Example in Graphic
If you want the find the least squares trend line through
INPUTS
1,5
2,4
3,6
4,8
5,7
The calculator will return "Y = 3.6 + 0.8X".
The Math / Science
The formula for the least-squared regression line is in the following form:
y = a + bx
where:
`b = ( (sum(XY) - (sumX * sumY)"/n")) / (sum(X^2) - (sumX)^2"/n") `
and
` a = MY - b*MX` MY is mean of Y. MX is mean of X.
Correlation
To determine if there is a correlation between X and Y, the calculator computes the correlation coefficient (r). The range of r is -1 ≤ r ≤ 1, with the strongest correlations the further one gets from zero, either negative or positive. The formula for the correlation coefficient (r) is as follows:
`r = b * (sum(X^2)- sum(X)^2"/n")/(sum(Y^2)- sum(Y)^2"/n")`

Linear Equation Functions
- Equation of a Line based on two points
- Compute the slope between two points
- Linear Equation
- Distance between a Point and Line
- Compute the Least-squares Linear Regression Equation
- Constant of Proportionality
- Constant of Inverse Proportionality
- Solution to Two Linear Equations (Cramer's Rule)
Statistics Calculators
- Observational Stats: This function accepts a table (rows and columns separated by commas) of numbers and calculates observational statistics for any of the columns. This includes count, min, max, sum, sum of squares (Σx²), square of the sum (Σx)², mean, median, mode, range, mid point, rand, sort up, sort down, rand, population variance, population standard deviation, the sample/experimental variance, sample/experimental standard deviation.
- Simple Stats: This is also provides a full set of observational stats, but on a single row of numbers separated by commas. The observational stats include count, min, max, sum, sum of squares (Σx²), square of the sum (Σx)², mean, median, mode, range, mid point, rand, sort up, sort down, rand, population variance, population standard deviation, the sample/experimental variance, sample/experimental standard deviation.
- Frequency Distribution: This function lets you enter a string of numbers separated by commas, a low and high range and a number of bins. It then computes how many of the observations are in each of the bins between the high and low values designated.
- Paired Sample t-test: This computes the various parameters associated with the Paired Sample t-test.
- ANOVA (one way): The computes the F Score and details for one way analysis of variance for a nxm matrix of observations.
- (χ2) Chi-Square Test: This computes the Chi-Square value for an nxm array of data and provides the degrees of freedom.
- Linear Regression
 : This computes the regression line (least-squares) through a set of X and Y observations. It also computes the regression coefficient (r).
 - Least-squares Trend Inference : This is a linear equation used with Linear Regression to compute a predicted value of Y based on X.
- Wilcoxon Signed Rank Test: This provides the Wilcoxon statistics and critical value for two groups of numeric observations based on an alpha value and whether it's a one or two tailed test.
- Slope-Intercept form of a Line: This provides the slope intercept form (y = mx+b) of a line based on two coordinates.
- Slope between two points: This provides the slope between two coordinates.
- Linear Equation: This computes the range (y) of a linear equation (y = mx +b) and includes a graphing function.
- Probability between z SCORES:
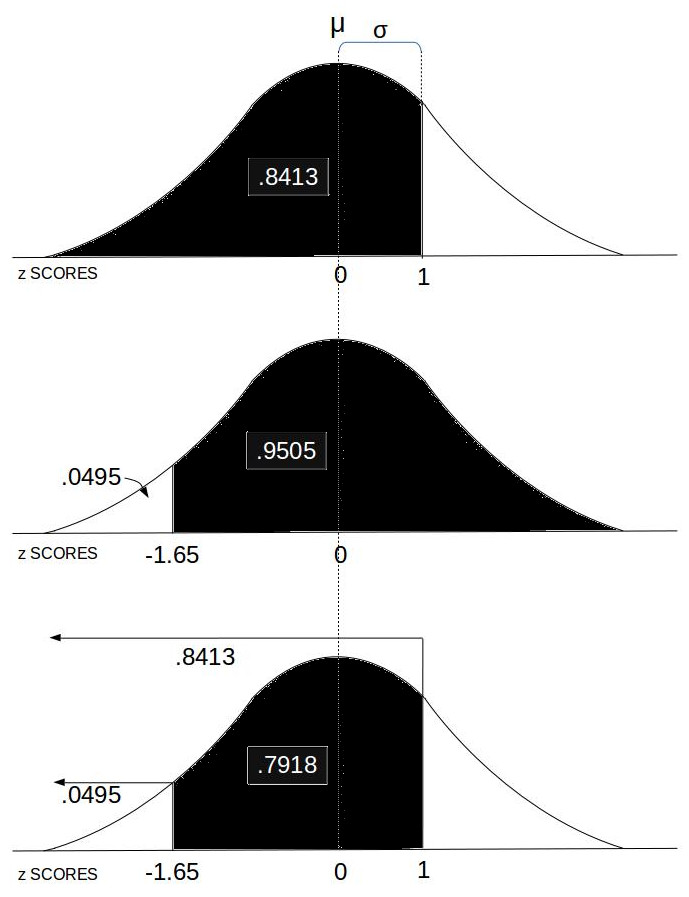 This computes the area under the Normal Distribution curve between two z SCOREs which equates to the probability of an event in that range.
 - Stats Calc: College level statistics calculator with a bundle including most of the functions in this list.
- Count: This computes the number (n) of observations in a set of numbers.
- Minimum: This computes the minimum (min) value in a set of numbers.
- Maximum: This computes the maximum (max) value in a set of numbers.
- Numeric Sort: This sorts (ascending or descending) a set of comma separated numerical observations.
- Random Sample (k items): The provides a random subset of a specified size (k) in a set of comma separated numerical observations.
- Random Real Number in Range: The provides a random real number between two specified real numbers (upper and lower bounds).
- Radom Integer: The provides a random integer between two specified integers (upper and lower bounds).
- Frequency Distribution: This provides a frequency distribution table for a comma separated set of numbers with a specified number of frequency bins between a lower and upper data range.
- Sum (Σx): This is computes the sum of the values in a set.
- Sum of Squares (Σx²): This computes the sum of the squared values in a set.
- Sum Squared (Σx)²: This computes the square of the summed values in a set.
- Mean (μ): This computes is the mean (average) of values in a set.
- Median: This identifies the middle ordered value in a set of numbers.
- Statistical Mode: This identifies the most recurring observation in a set of numbers.
- Mid Point: This is identifies the mid point of the observation range in a set of numbers.
- Range: This is computes the difference between the max and the min values in a set of number.
- Population Variance (σ2): This computes the variance, a metric regarding the spread of values, for a population set of numeric values.
- Population Standard Deviation (σ): This computes the standard deviation for a population set of numeric values.
- Sample Variance (s2) : This computes the variance, a metric regarding the spread of values, for a sample set of numeric values within a greater population.
- Sample Standard Deviation (s): This computes the standard deviation for a sample set of numeric values within a greater population.
- z SCORE Formula: This computes the z SCORE for a value base on the mean and standard deviation.
- z SCORE: This computes the z SCORE for a value (Raw Score) based on a set of values, and whether that set is sample or population.
- Percentile: This computes the percentile of a value (y) in a set (X) of values.
- Standard Deviation of Mean (SDOM): This computes the standard deviation of mean, sometimes also known as the standard error of the mean (SEM), useful to helps quantify the uncertainty in the estimate of the mean.
- Percent Relative Standard Deviation (%RSD): This computes the percent relative standard deviation, also known as the coefficient of variation (CV). The %RSD is a measure of the dispersion of a probability distribution.
References
- Dowdy, Shirley, and Stanley Wearden. Statistics for Research. N.p.: John Wiley & Sons, n.d. Print.(Chapter 9 Distributions of Paired Variables)